


customLayout is a simple extension of the basic layout function from R but it works not only with base and grid graphics systems, but also with PowerPoint slides using officer package.
Instalation:
customLayout is available on CRAN:
install.packages("customLayout")The development version can be installed from GitHub using devtools:
library(devtools)
install_github("zzawadz/customLayout")
Basic functionality:
You can create layouts in the using the same syntax as in the base layout function:
library(customLayout)
lay <- lay_new(
  matrix(1:4, nc = 2),
  widths = c(3, 2),
  heights = c(2, 1))
lay_show(lay)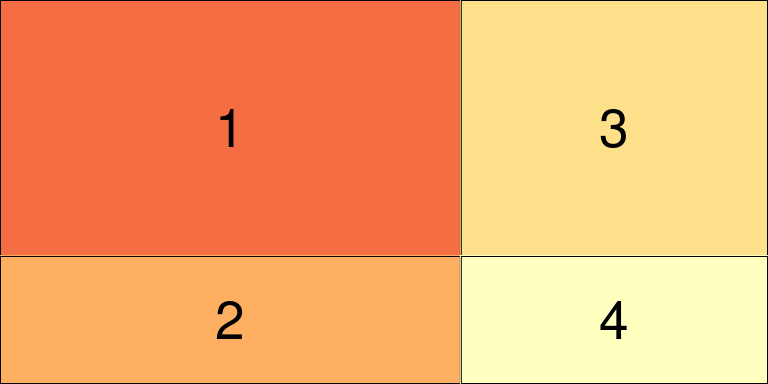
But the main strength of this package is in combining created layouts with specific ratio:
# lay will be 3 times wider that lay2
# all ascects in lay and lay2 will be preserved
cl = lay_bind_col(lay, lay2, widths = c(3, 1))
lay_show(cl)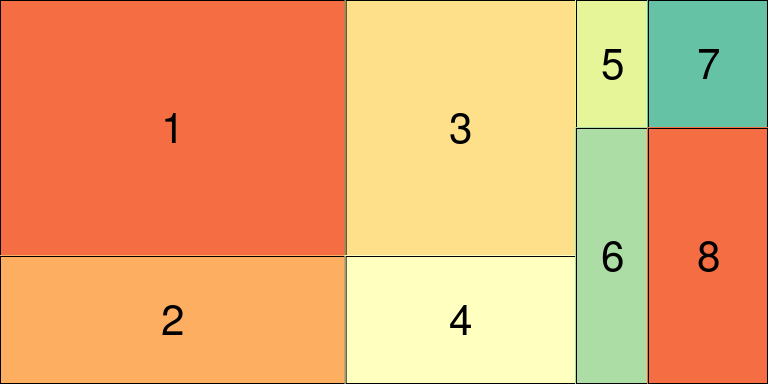
You can create even more complicated layouts:
lay3 <- lay_new(matrix(1:2))
lay4 <- lay_bind_row(cl, lay3, heights = c(5, 2))
lay_show(lay4)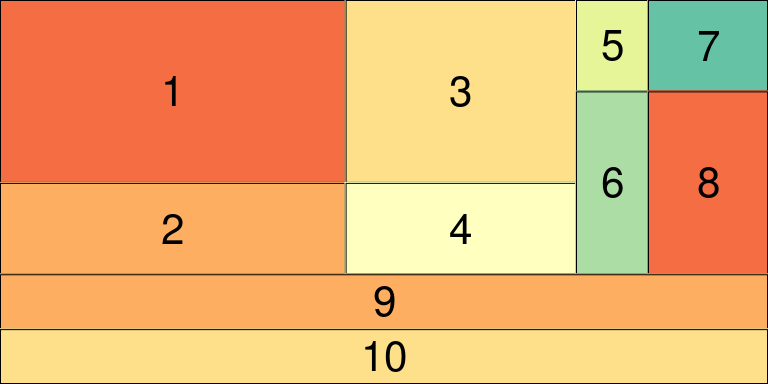
lay5 <- lay_bind_col(lay4, lay3, widths = c(5, 2))
lay_show(lay5)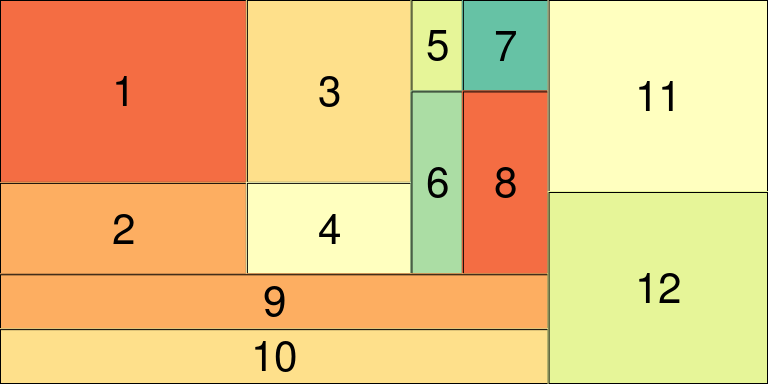
Split layout
You can create very complicated layouts by splitting one field:
library(customLayout)
lay <- lay_new(
matrix(1:4, nc = 2),
widths = c(3, 2),
heights = c(2, 1))
lay_show(lay)
lay2 <- lay_new(
  matrix(1:4, nc = 2),
  widths = c(3, 5),
  heights = c(2, 4))
lay_show(lay2)
# Split field 4 from lay into lay2:
slay <- lay_split_field(lay, lay2, field = 4)
lay_show(slay)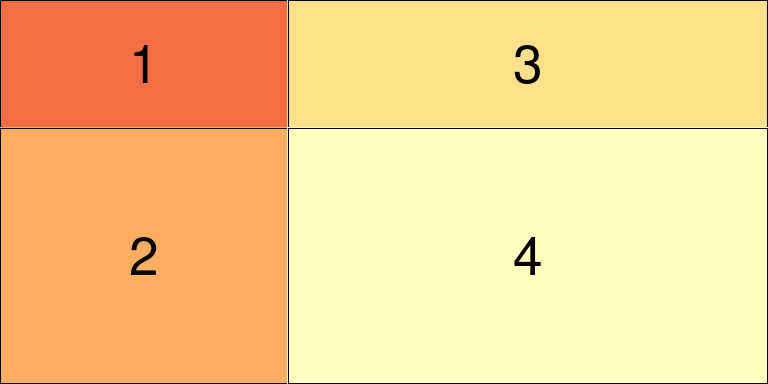
Example session:
Base graphics
library(customLayout)
par(mar = c(3, 2, 2, 1))
lay  <- lay_new(
  matrix(1:4, nc = 2),
  widths = c(3, 2),
  heights = c(2, 1))
lay2 <- lay_new(matrix(1:3))
cl   <- lay_bind_col(lay, lay2, widths = c(3, 1))

lay_set(cl) # initialize drawing area

set.seed(123)
plot(1:100 + rnorm(100))
plot(rnorm(100), type = "l")
hist(rnorm(500))
acf(rnorm(100))
pie(c(3, 4, 6), col = 2:4)
pie(c(3, 2, 7), col = 2:4 + 3)
pie(c(5, 4, 2), col = 2:4 + 6)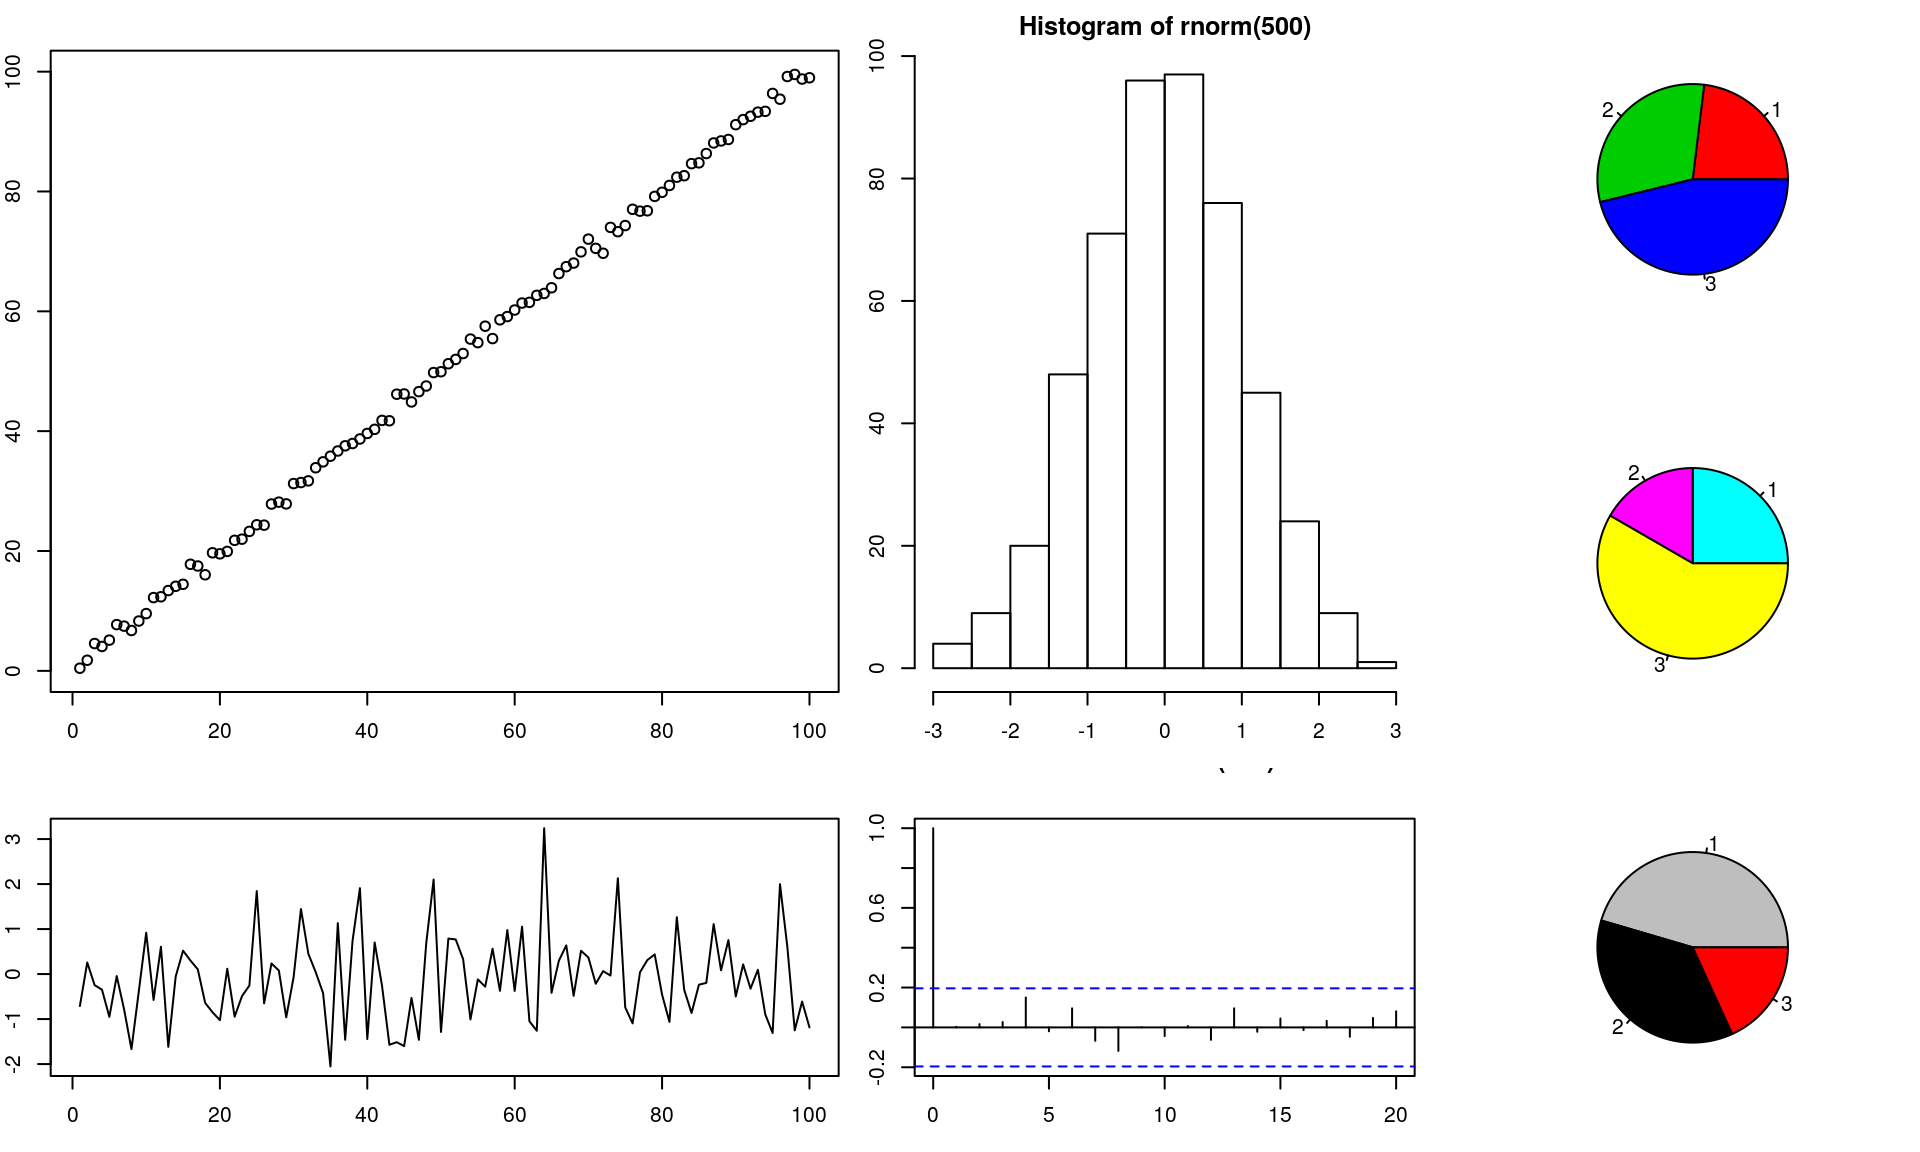
Grid graphics (ggplot2 and friends)
library(customLayout)
library(ggplot2)
library(gridExtra)

lay  <- lay_new(
  matrix(1:2, ncol = 1))
lay2 <- lay_new(matrix(1:3))
cl   <- lay_bind_col(lay, lay2, widths = c(3, 1))


library(ggplot2)
cuts <- sort(unique(diamonds[["cut"]]),
            decreasing = TRUE)

make_cut_plot <- function(cut) {
  dd <- diamonds[diamonds[["cut"]] == cut, ]
  pl <- ggplot(dd) +
      geom_point(aes(carat, price)) +
      facet_wrap("cut")
  pl
}

plots <- lapply(cuts, make_cut_plot)

lay_grid(plots, cl)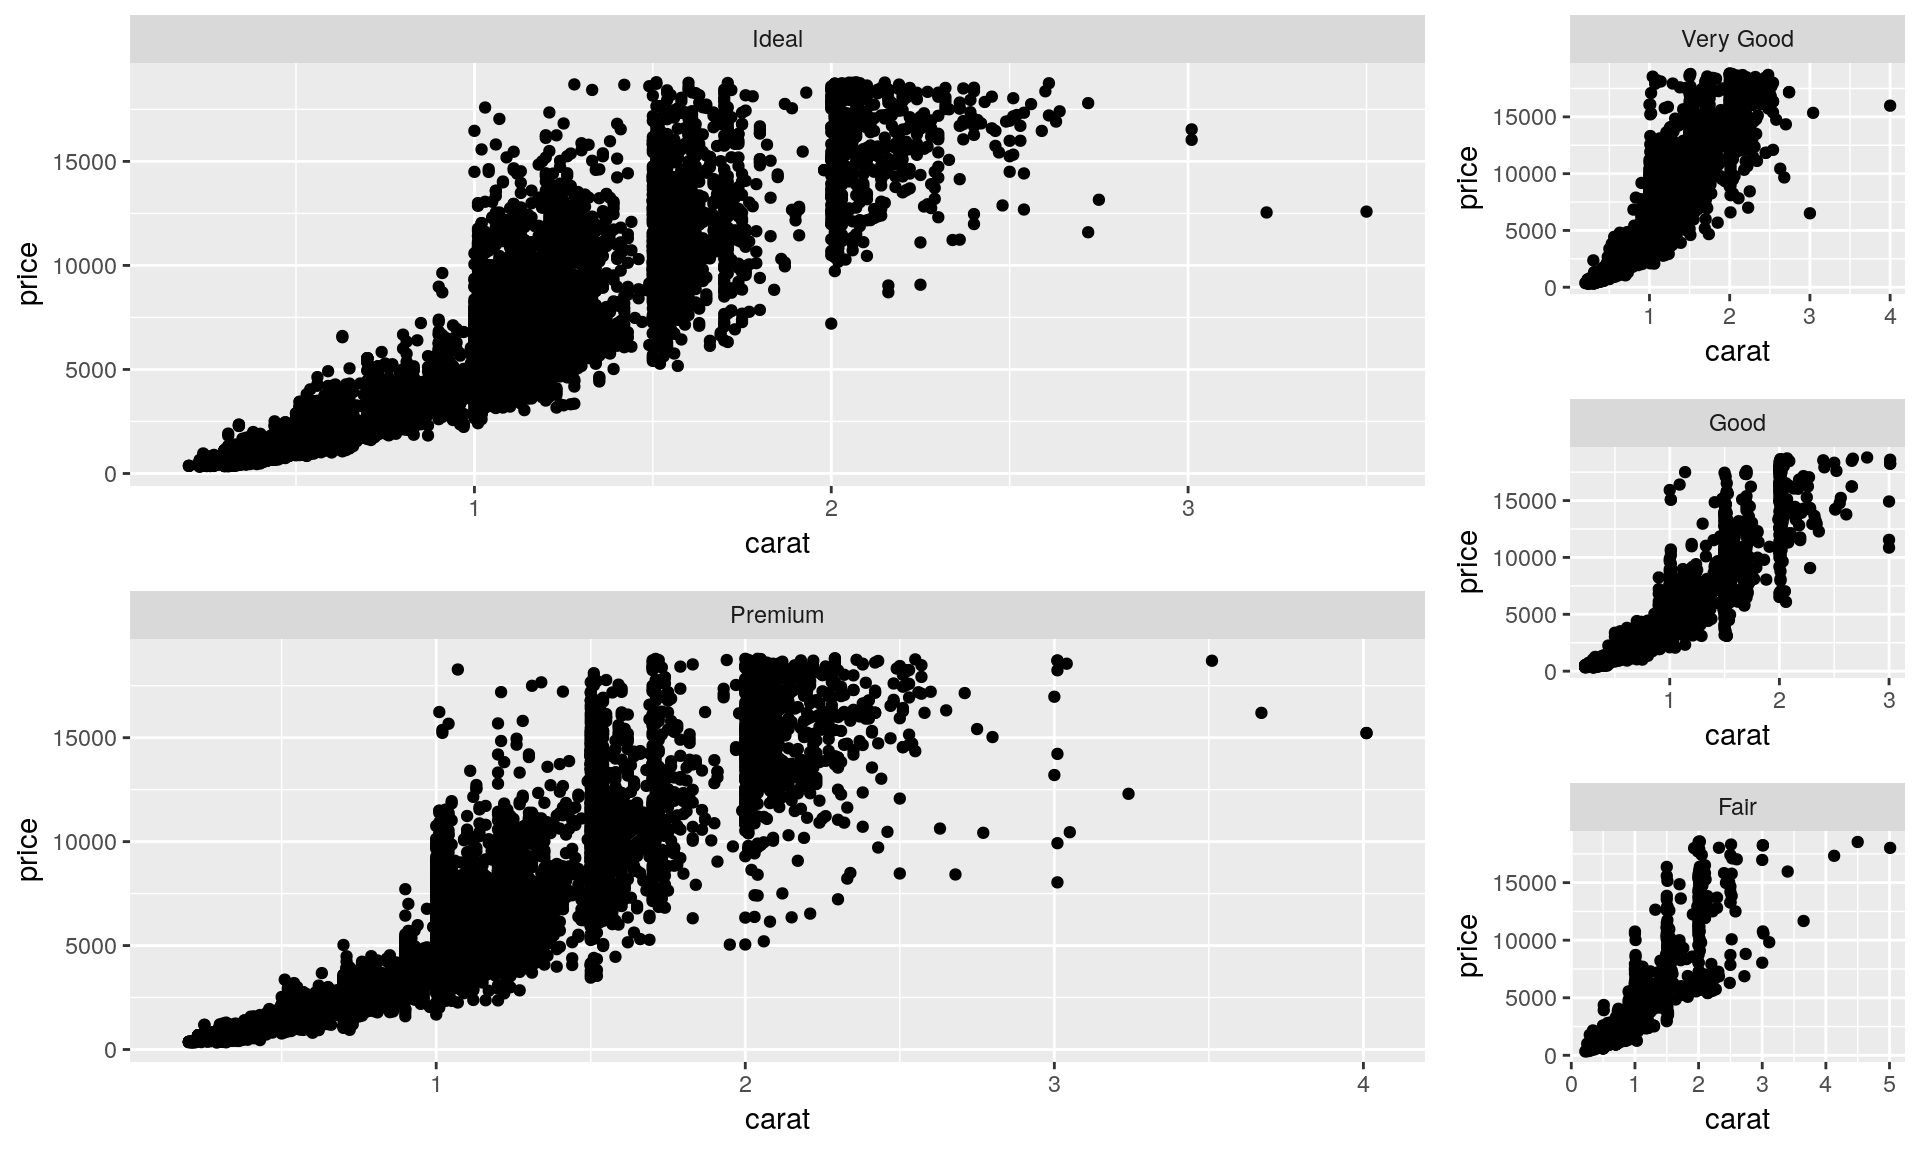
PowerPoint support
Layouts created using customLayout package can be used to arrange elements on the PowerPoint slide. For the detailed description please refer to the vignette:
vignette("layouts-for-officer-power-point-document", package = "customLayout")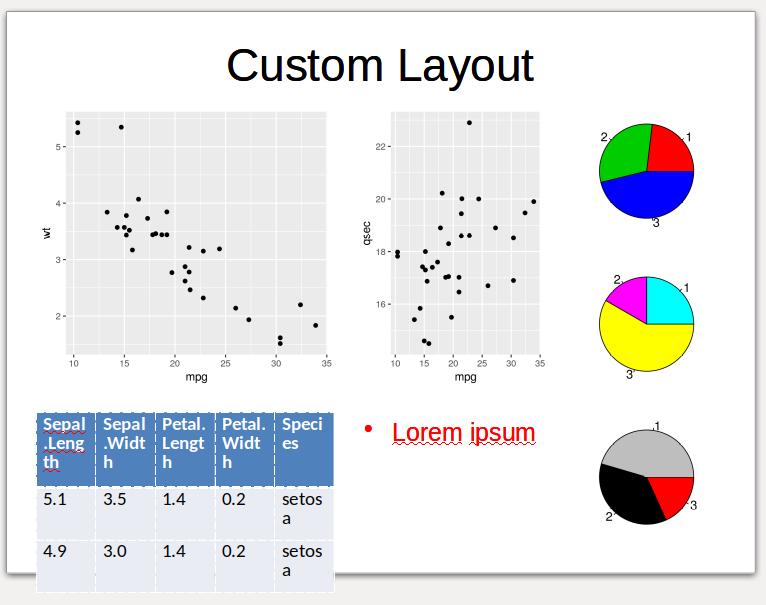
Comparison with other packages
customLayout vs patchwork vs cowplot:
| Feature | customLayout | patchwork | cowplot |
|---|---|---|---|
| Base graphics support | Yes | No | No |
| ggplot2 support | Yes | Yes | Yes |
| PowerPoint export | Yes | No | No |
| Matrix-based specification | Yes | No | No |
| Operator syntax (+, /, |) | No | Yes | No |
| Auto panel labels | No | Yes | Yes |
| Legend collection | Manual | Yes | Manual |
| Inset plots | No | Yes | Yes |
| Aspect ratio preservation | Yes | Yes | Yes |
| Axis alignment | N/A | Yes | Yes |
For a detailed comparison with examples, see the comparison vignette.